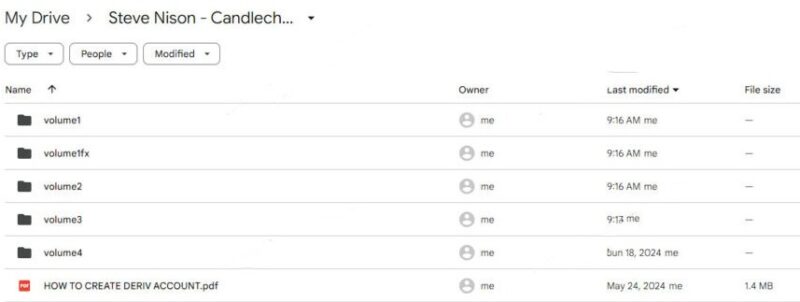
Steve Nison – Candlecharts Course

Elevate Your Trading with Steve Nison’s Candlecharts Course
Embark on a transformative journey into trading with the Steve Nison Candlecharts Course. This comprehensive program, meticulously crafted by Steve Nison, the pioneer of candlestick charting in the Western world, unlocks the secrets of analyzing and understanding market movements through candlestick patterns.
Whether you are just starting out or are a seasoned trader, this course equips you with the tools to enhance your trading decisions. It helps you understand market sentiment and anticipate trends with greater accuracy.
Introduction to Candlestick Charting
The Origin and Evolution of Candlestick Charting
Candlestick charting, a technique developed in Japan over 100 years ago, provides traders with a visual representation of market psychology and price movement. Steve Nison, credited with introducing this method to Western traders in the 1990s, has tailored the Candlecharts Course to demystify these patterns for traders worldwide.
This section of the course covers the historical significance of candlestick charting as well as its relevance and application in today’s trading landscape.
Understanding Market Sentiment with Candlesticks
The course begins by laying a solid foundation, explaining the components of candlesticks—body, wick, and colour—and how they represent market actions. Students learn to differentiate between bullish and bearish candlesticks, setting the stage for more complex pattern recognition that can significantly enhance predictive abilities in trading.
Key Candlestick Patterns and Their Interpretations
Single and Dual Candlestick Patterns
Steve Nison’s course delves into crucial candlestick patterns, starting with single candlestick signals such as the Doji, which indicates market indecision, and the Hammer and Hanging Man, which signal potential market reversals. Dual patterns like Engulfing and Harami patterns are also covered extensively, providing insights into likely market direction changes and trend continuations or reversals.
Advanced Patterns and Combinations
The course further explores triple candlestick patterns, including the Morning Star and Evening Star, powerful indicators of trend reversals, and patterns like Three Black Crows and Three White Soldiers, which indicate strong trend momentum.
These patterns are essential for traders aiming to grasp the nuances of market shifts and momentum.
Integrating Technical Analysis for Robust Trading Strategies
Support, Resistance, and Volume Analysis
A vital component of the Candlecharts Course is integrating candlestick patterns with other technical analysis tools. Students learn how to identify and confirm support and resistance levels, integrate volume analysis to validate candlestick formations, and apply these patterns with other indicators to develop a rounded trading strategy.
Practical Application and Risk Management
Practical application forms the core of the course, where traders learn to identify high-probability trade setups using candlestick patterns combined with risk management strategies such as setting appropriate stop-loss and take-profit levels. Through detailed case studies and real-world examples, students see how these strategies are applied in actual trading scenarios, enhancing their theoretical and practical knowledge.
Advanced Techniques and Continuous Learning
Multiple Time Frame Analysis and Pattern Reliability
Steve Nison’s teaching goes beyond basic pattern recognition, offering advanced insights into using candlestick patterns across different time frames to create a comprehensive market view. This approach helps align short-term trading signals with long-term trends, improving decision-making and strategic planning.
Integration with Modern Trading Tools
The course also emphasizes the importance of modern technology in trading, teaching students how to use contemporary charting software for pattern identification and analysis. This integration ensures that students are prepared to use these tools effectively in their trading practices.
Instructor’s Expertise and Additional Resources
Steve Nison’s Teaching Approach
Known for his ability to simplify complex concepts, Steve Nison’s teaching approach focuses on practical application and developing a trader’s intuition for market dynamics. His step-by-step guidance ensures that students learn the techniques and understand how to apply them in varied trading situations.
Comprehensive Learning Resources
Students of the Candlecharts Course gain access to a wealth of resources including Steve Nison’s books and publications, supplementary materials like cheat sheets, video tutorials, and exclusive membership in online forums and groups. These resources provide ongoing support and ensure continuous learning, allowing traders to stay updated with the latest strategies and market trends.
Conclusion: Achieving Trading Mastery with Candlecharts
By the end of the Candlecharts Course, traders are well-equipped to interpret and leverage candlestick patterns to enhance their trading strategies. The comprehensive coverage of candlestick charting and its practical applications makes this course suitable for traders of all experience levels who seek to improve their technical analysis skills and achieve more tremendous success in the trading world.
Enroll in Steve Nison’s Candlecharts Course today and transform your approach to trading with the profound insights and expert guidance it offers.


